Every Examination Generates Intelligence.
Move beyond simple grading. Amatyas transforms raw student response vectors, proctoring signals, and timing markers into institutional insight. Optimize curriculum, measure center efficiency, and secure academic standards instantly.
Real-Time Psychometric Insights
Item difficulty indices, discrimination parameters, Cronbach alpha reliability calibrations, and suspicious score variance alerting.
Continuous Diagnostic Profiling
Amatyas constructs a rich biometric and performance record for each candidate. Identify gifted pathways or student struggle thresholds weeks before final reporting, with automatic recommendations triggered by AI telemetry.
- Adaptive percentile positioning tracking
- Strength-to-weakness variance calculations
- Response-delay latency indicators per concept
Topic Mastery Radar
Distractor Selection Heatmap
Deep-Dive Item Level Analytics
Identify flawed questions instantly. Amatyas automatically flags items with low discrimination scores or skewed distraction coefficients. Refine test banks dynamically over successive cohorts.
Point-Biserial Correlations
Automated verification of question-to-overall score dependency structures.
Syllabus Alignment Matrix
Intelligent mapping of responses back to raw learning output guidelines.
Cross-Centre Calibration Matrix
Audit test center integrity, network speed consistency, and proctoring efficiency ratios globally. Benchmark institutions on unified difficulty and performance grids.
Regional Performance Leaderboard
Standard Deviation Analysis across Locations
Track evaluation accuracy patterns. Ensure grading compliance and eliminate regional scoring skews with unified normalization blueprints that calibrate marks across physical bounds.
Real-Time Attendance Monitoring
Keep complete control over candidate lifecycle streams. Track registration peaks, predict candidate no-shows before final locks, and manage geographic distribution spikes.
99.8% Log Integrity
No registration packet drops or timing mismatches logged.
Geo-Cluster Balancing
Automatic latency matching redirects connection pipes instantly.
Autonomous Score Distribution & Curvature
Render exact grade distribution bell curves instantly. Set percentile boundaries, apply psychometric normalization tools, and validate cut-score metrics with certified mathematical accuracy.
Subject Accuracy Map
Section Drill-Down
CalibratedTrack exact topic mastery ratios across parallel cohorts instantly. Verify calibration stability within 0.2s of submission events.
Subject & Section Level Drill-Downs
Amatyas organizes test telemetry into clean logical grids. Drill down into conceptual modules instantly to see where curriculum delivery meets learning output targets, and where it falls short.
YoY Historical Trend Analytics
Unlock longitudinal insights. Trace candidate cohort success levels over multiple years, identify historical cycles, and build predictive model parameters.
Baseline curriculum standard established
Integrity shields fully implemented
Fully automated calibration active
Deep-Dive Result Calibration
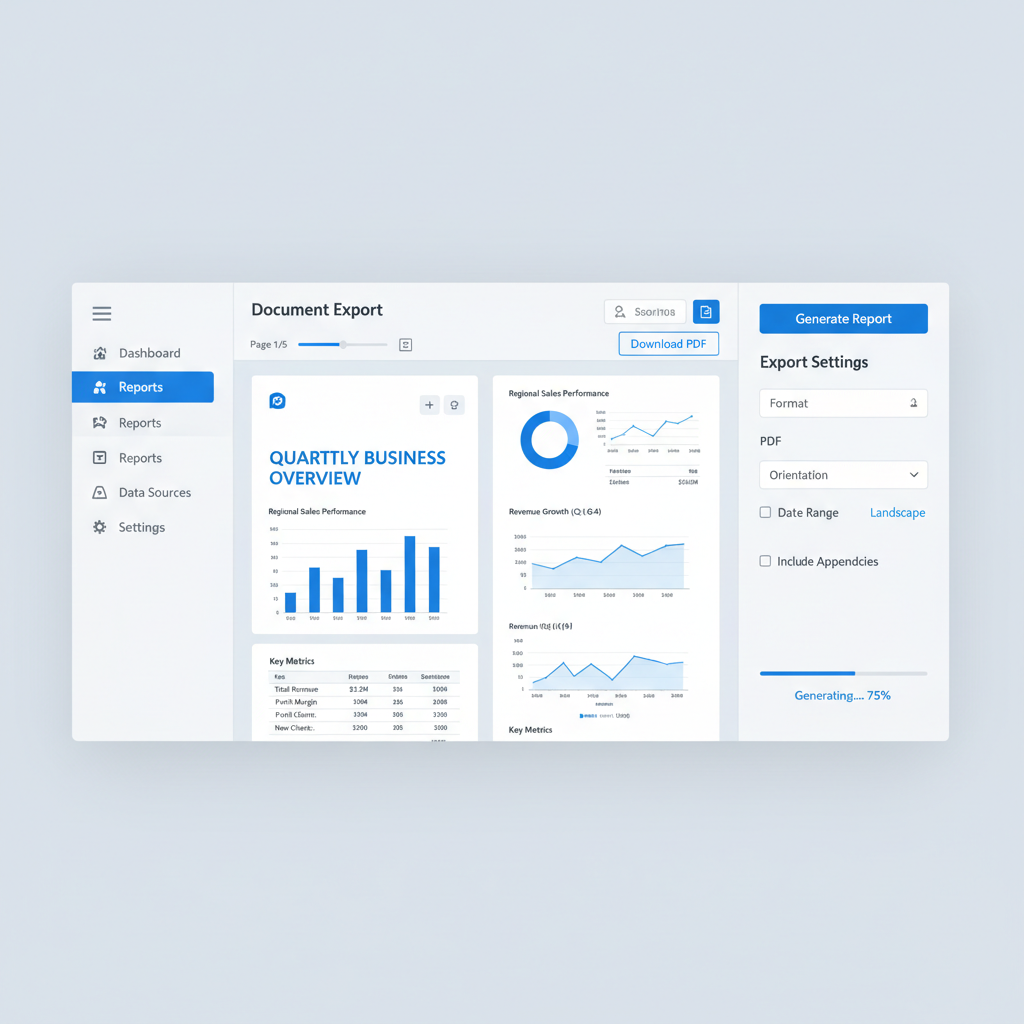
Standardized, Rich Document Export
Generate complex statistical summaries and PDF scorecards automatically. Create, schedule, and distribute reports matching regional and corporate telemetry standards globally.
Unlock Infinite Insights Today
Empower your organization with scalable analytical matrices, secure calibration loops, and beautiful automated reporting templates.